NAA Inflation Tracker: June 2022
CPI, Latest Release, May 2022
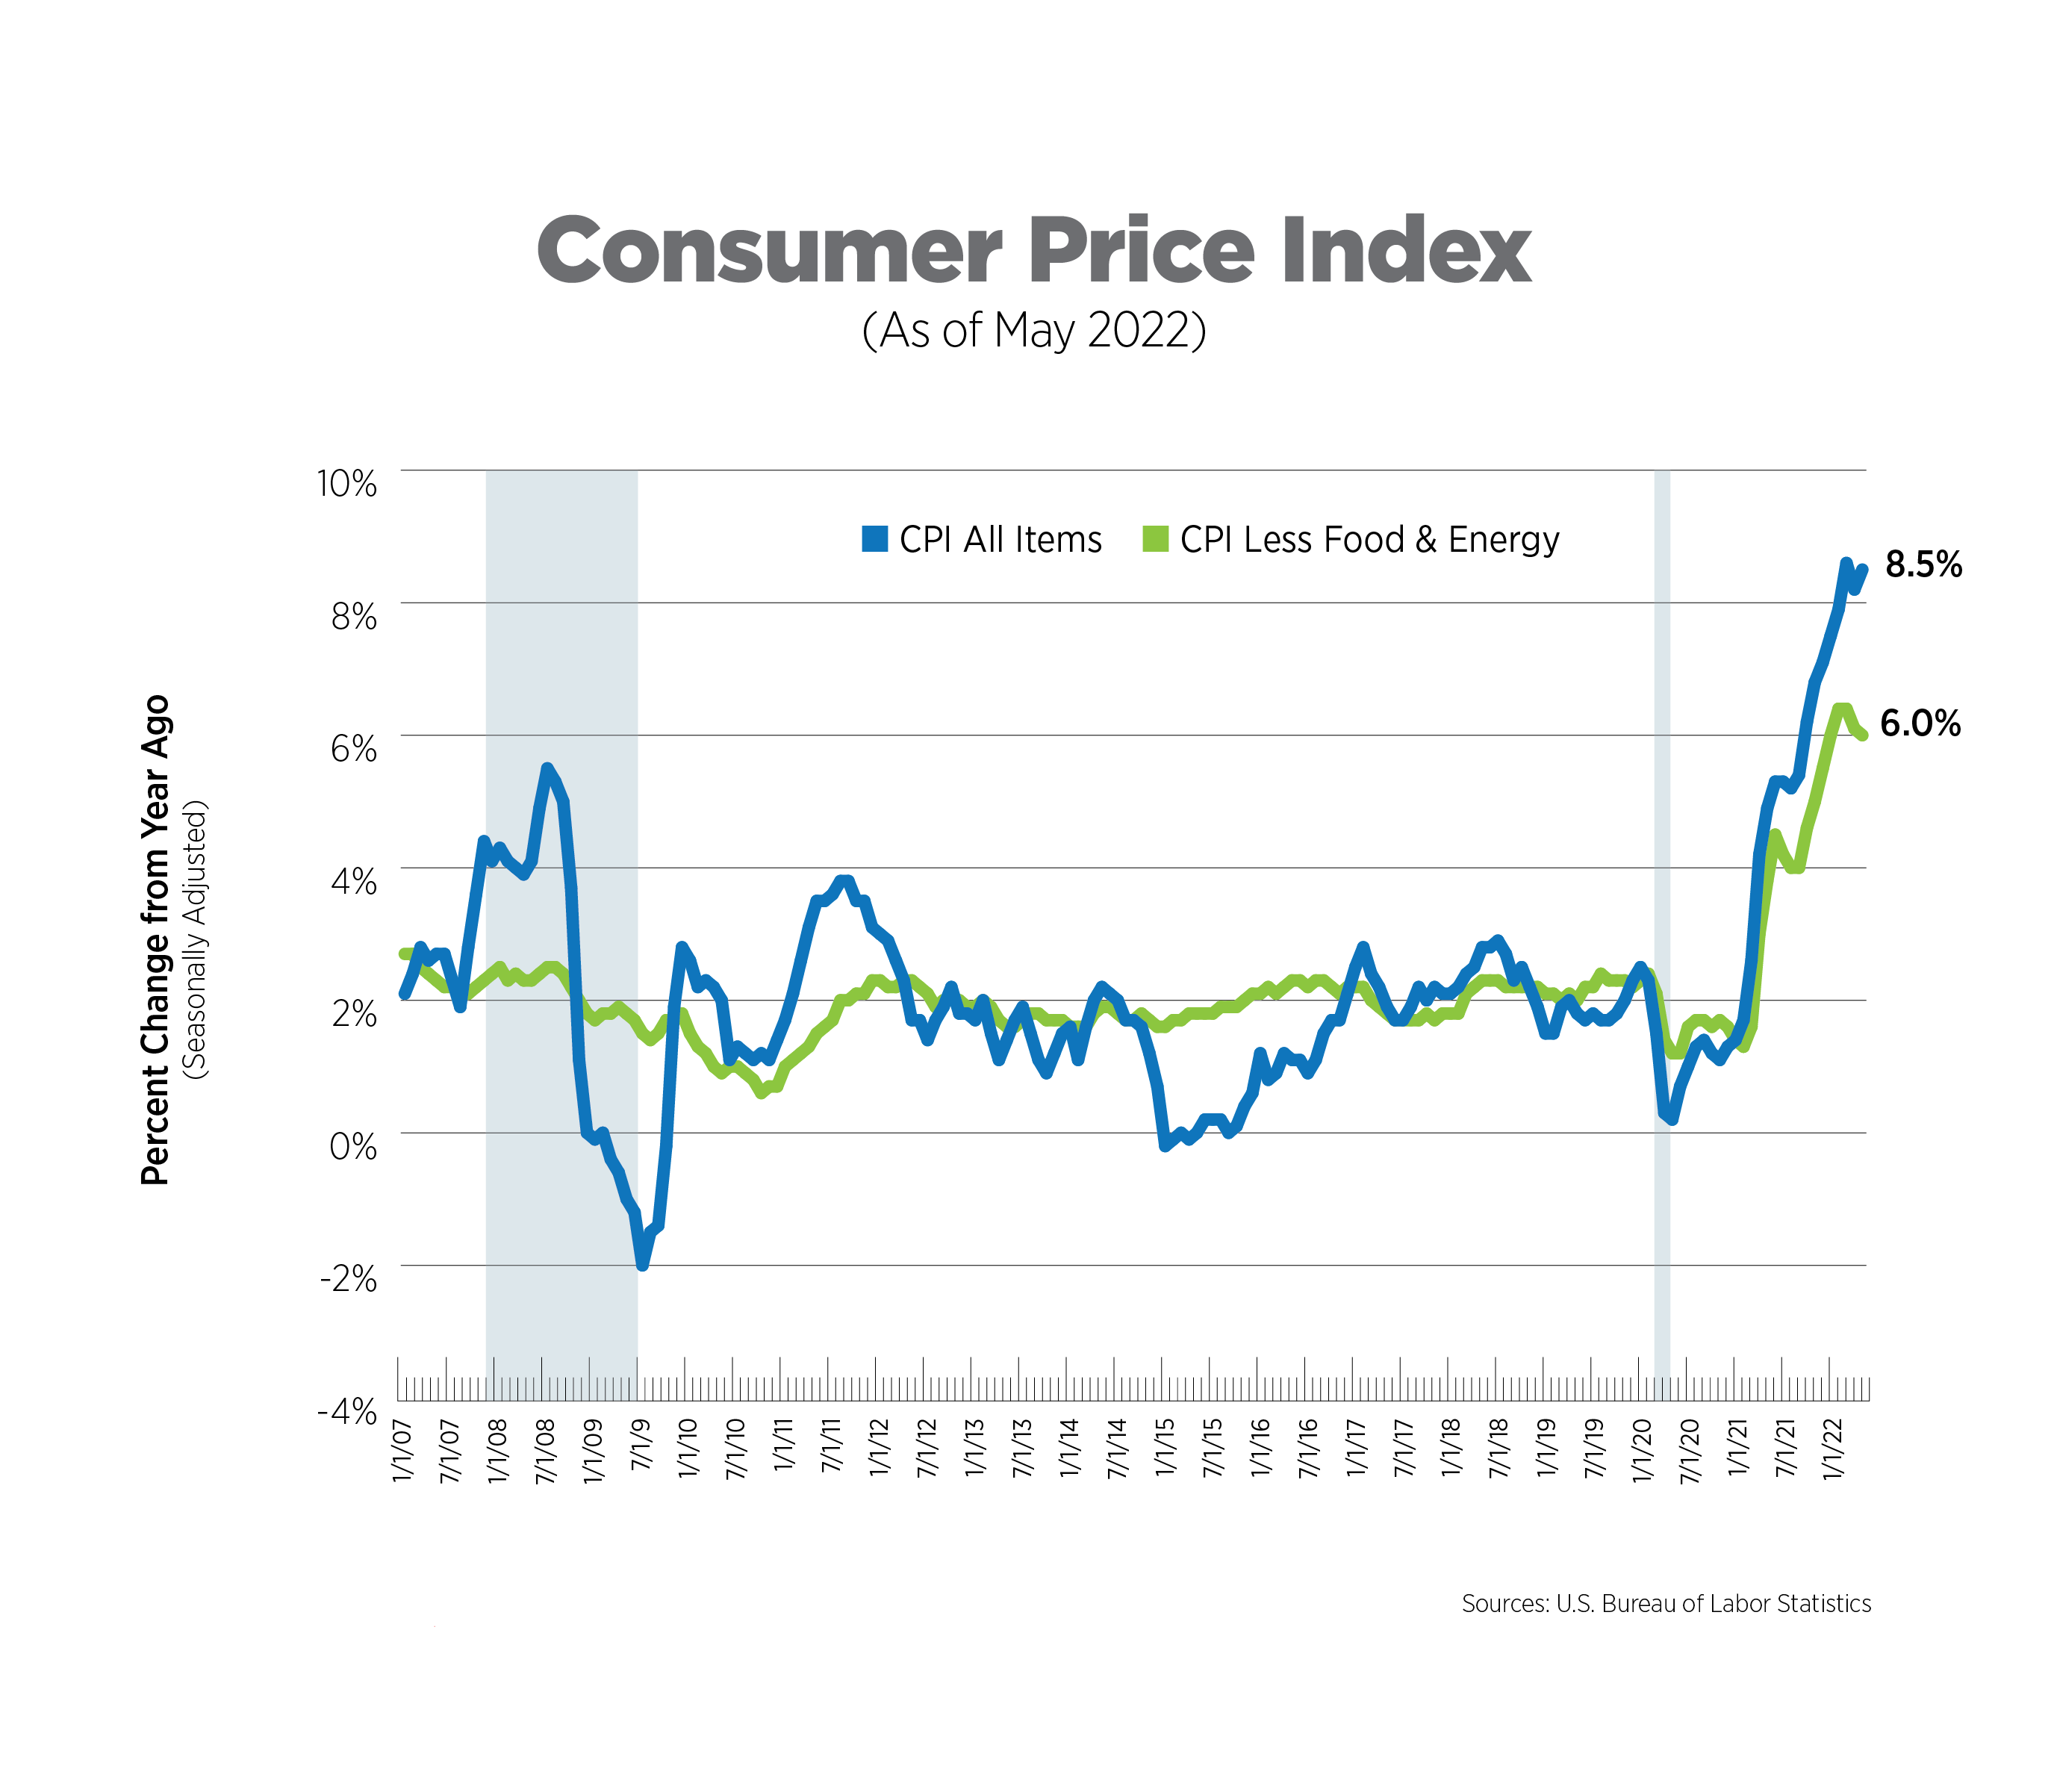
By all measures – headline, core, monthly and annually – the May Consumer Price Index (CPI) came in hotter than expected. Headline CPI increased 8.5% (seasonally adjusted) year-over-year and 1.0% since last month. Not surprising, the energy index was up 34.6% year-over-year while food prices rose 10.1%, the first double-digit increase since the early 1980s. Core CPI increased 6.0% year-over-year and 0.6% for the month, matching last month’s increase and driven by airline fares (12.6% after last month’s 18.6% increase) and used cars and trucks, up 1.8%. Owners’ equivalent rent experienced its highest monthly increase (0.6%) since 1999, while rent of primary residence came in at the highest level since 1990, also 0.6%.
There is some speculation among analysts that the Fed could be even more aggressive and increase interest rates by 0.75 points rather than 0.50 points. The Fed meets next week, and not only will it be announcing the next rate increase, but it will be updating economic projections for the coming years. Expect the GDP forecast to be downgraded.
Inflation Expectations, April 2022
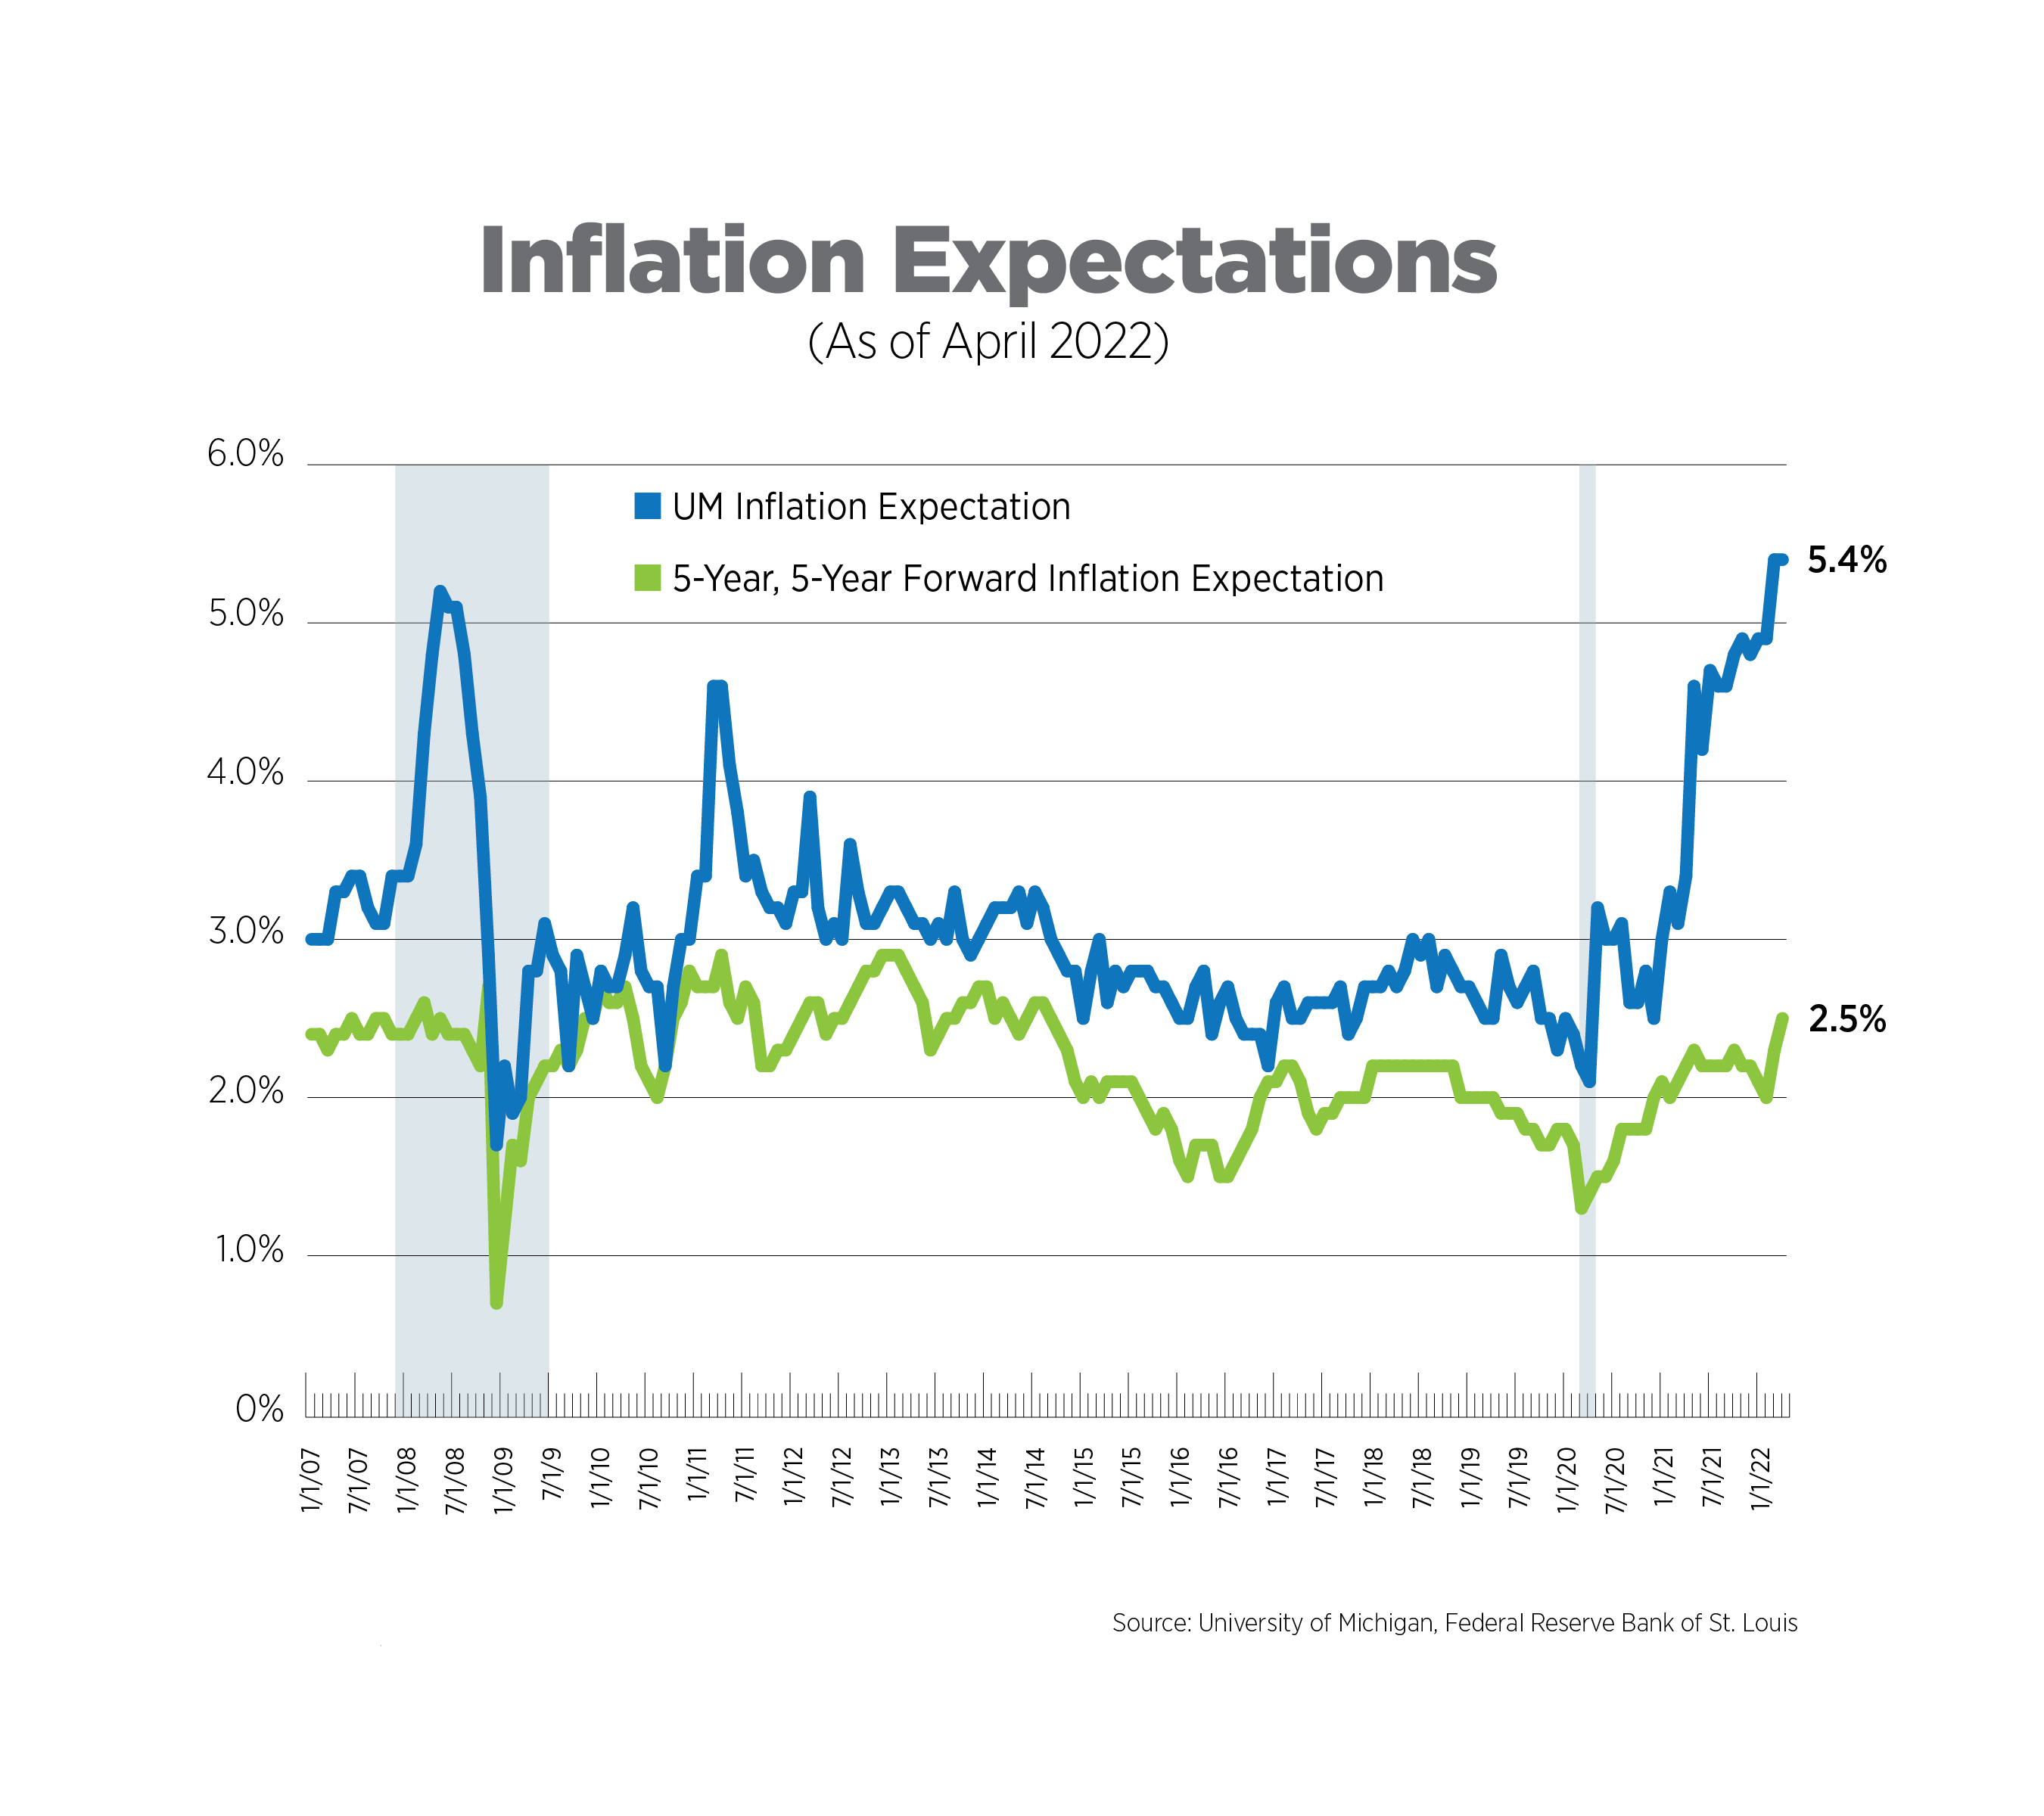
The Fed tracks 21 different measures of inflation expectations. The two measures presented in the chart below are from the University of Michigan’s Consumer Sentiment Survey, specifically the question asking about one-year inflation expectations; and the 5-year, 5-year forward rate, which measures inflation expectations from the period beginning 5 years from today for the subsequent 5 years, based on both nominal and inflation-adjusted 5- and 10-year Treasury rates.
Consumers’ expectations for inflation one year from now moderated at 5.4% in April, with more than half of survey respondents expecting gas prices to continue to rise over the next year. Inflation expectations five years from now have remained at 3.0% for the past several months, above the Treasury calculation of 2.5%.
Alternative Measures of Inflation, March 2022
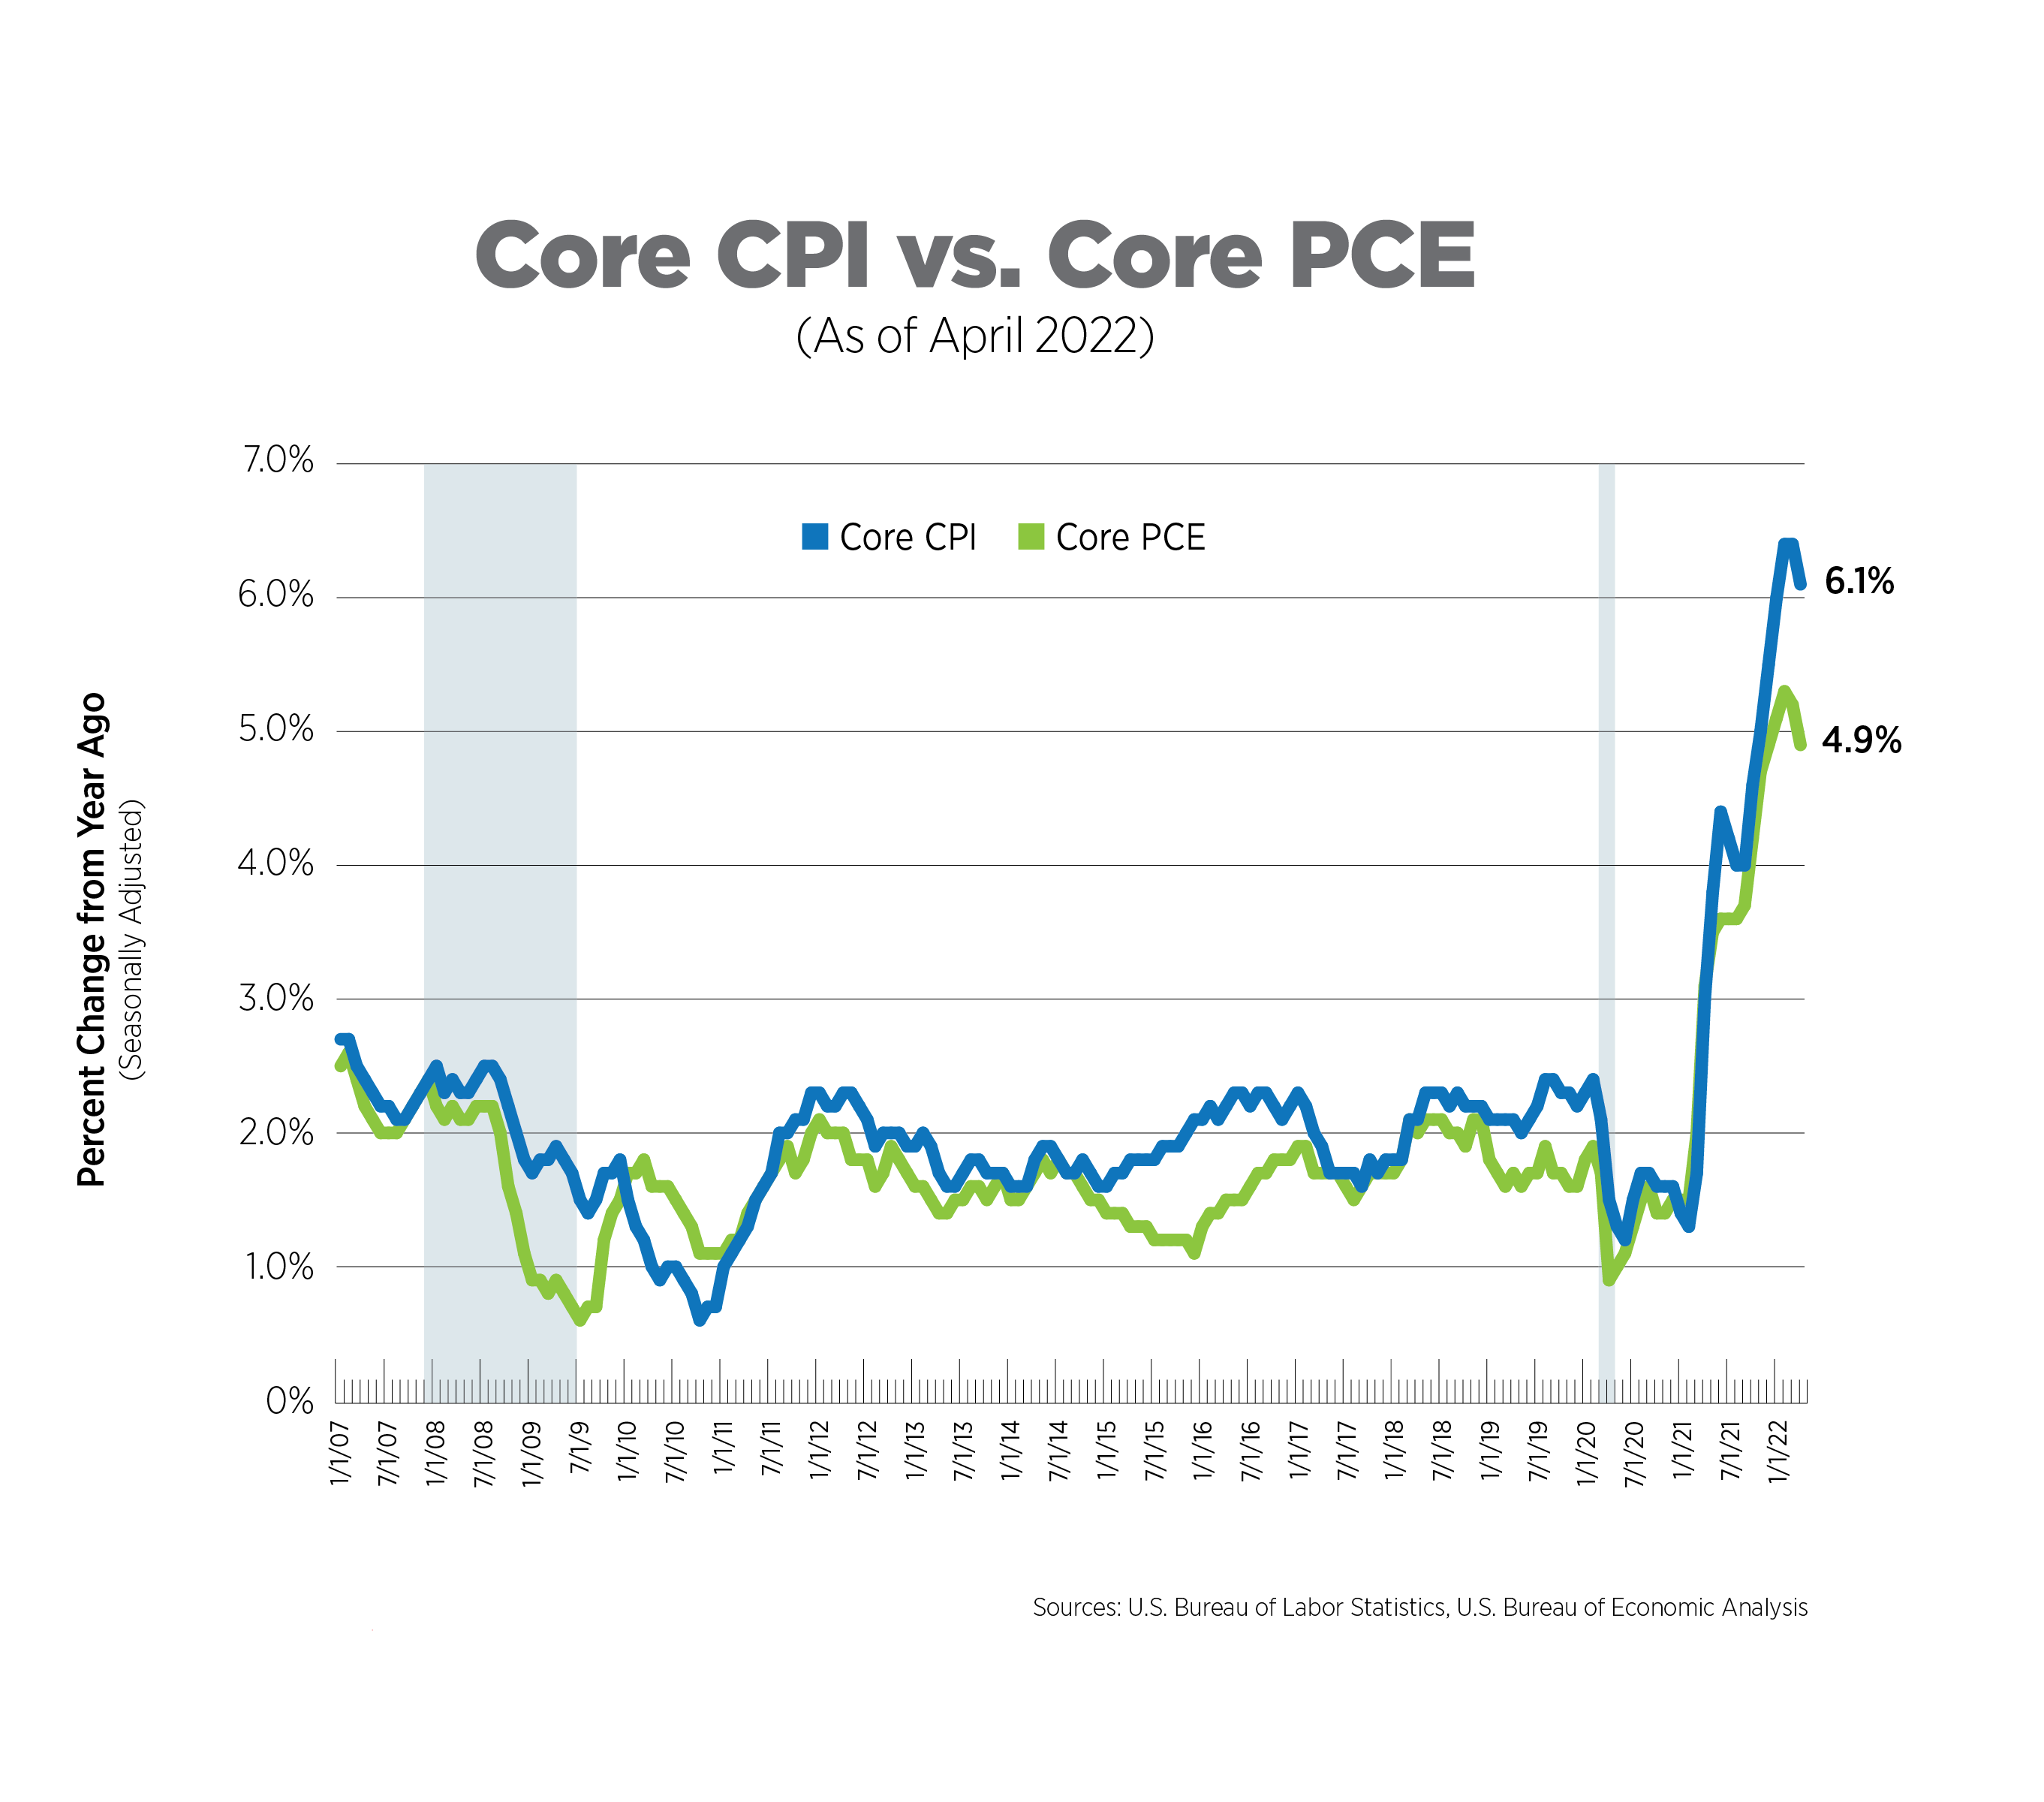
The core Personal Consumption Expenditures (PCE) Index is the measure of inflation the Federal Reserve Bank uses in its policy decisions. It is produced by the Bureau of Economic Analysis and uses different formulas, different weights and has a different scope compared to the Bureau of Labor Statistics’ (BLS) CPI.
PCE increased 6.3% year-over-year, driven mainly by food prices. Core PCE was up 4.9% year-over-year and 0.3% on a monthly basis, the same level as the prior two months. Monthly price increases for goods and services were essentially equal in April at 0.8% and 0.9%, respectively.
Multifamily Construction Input Prices, March 2022
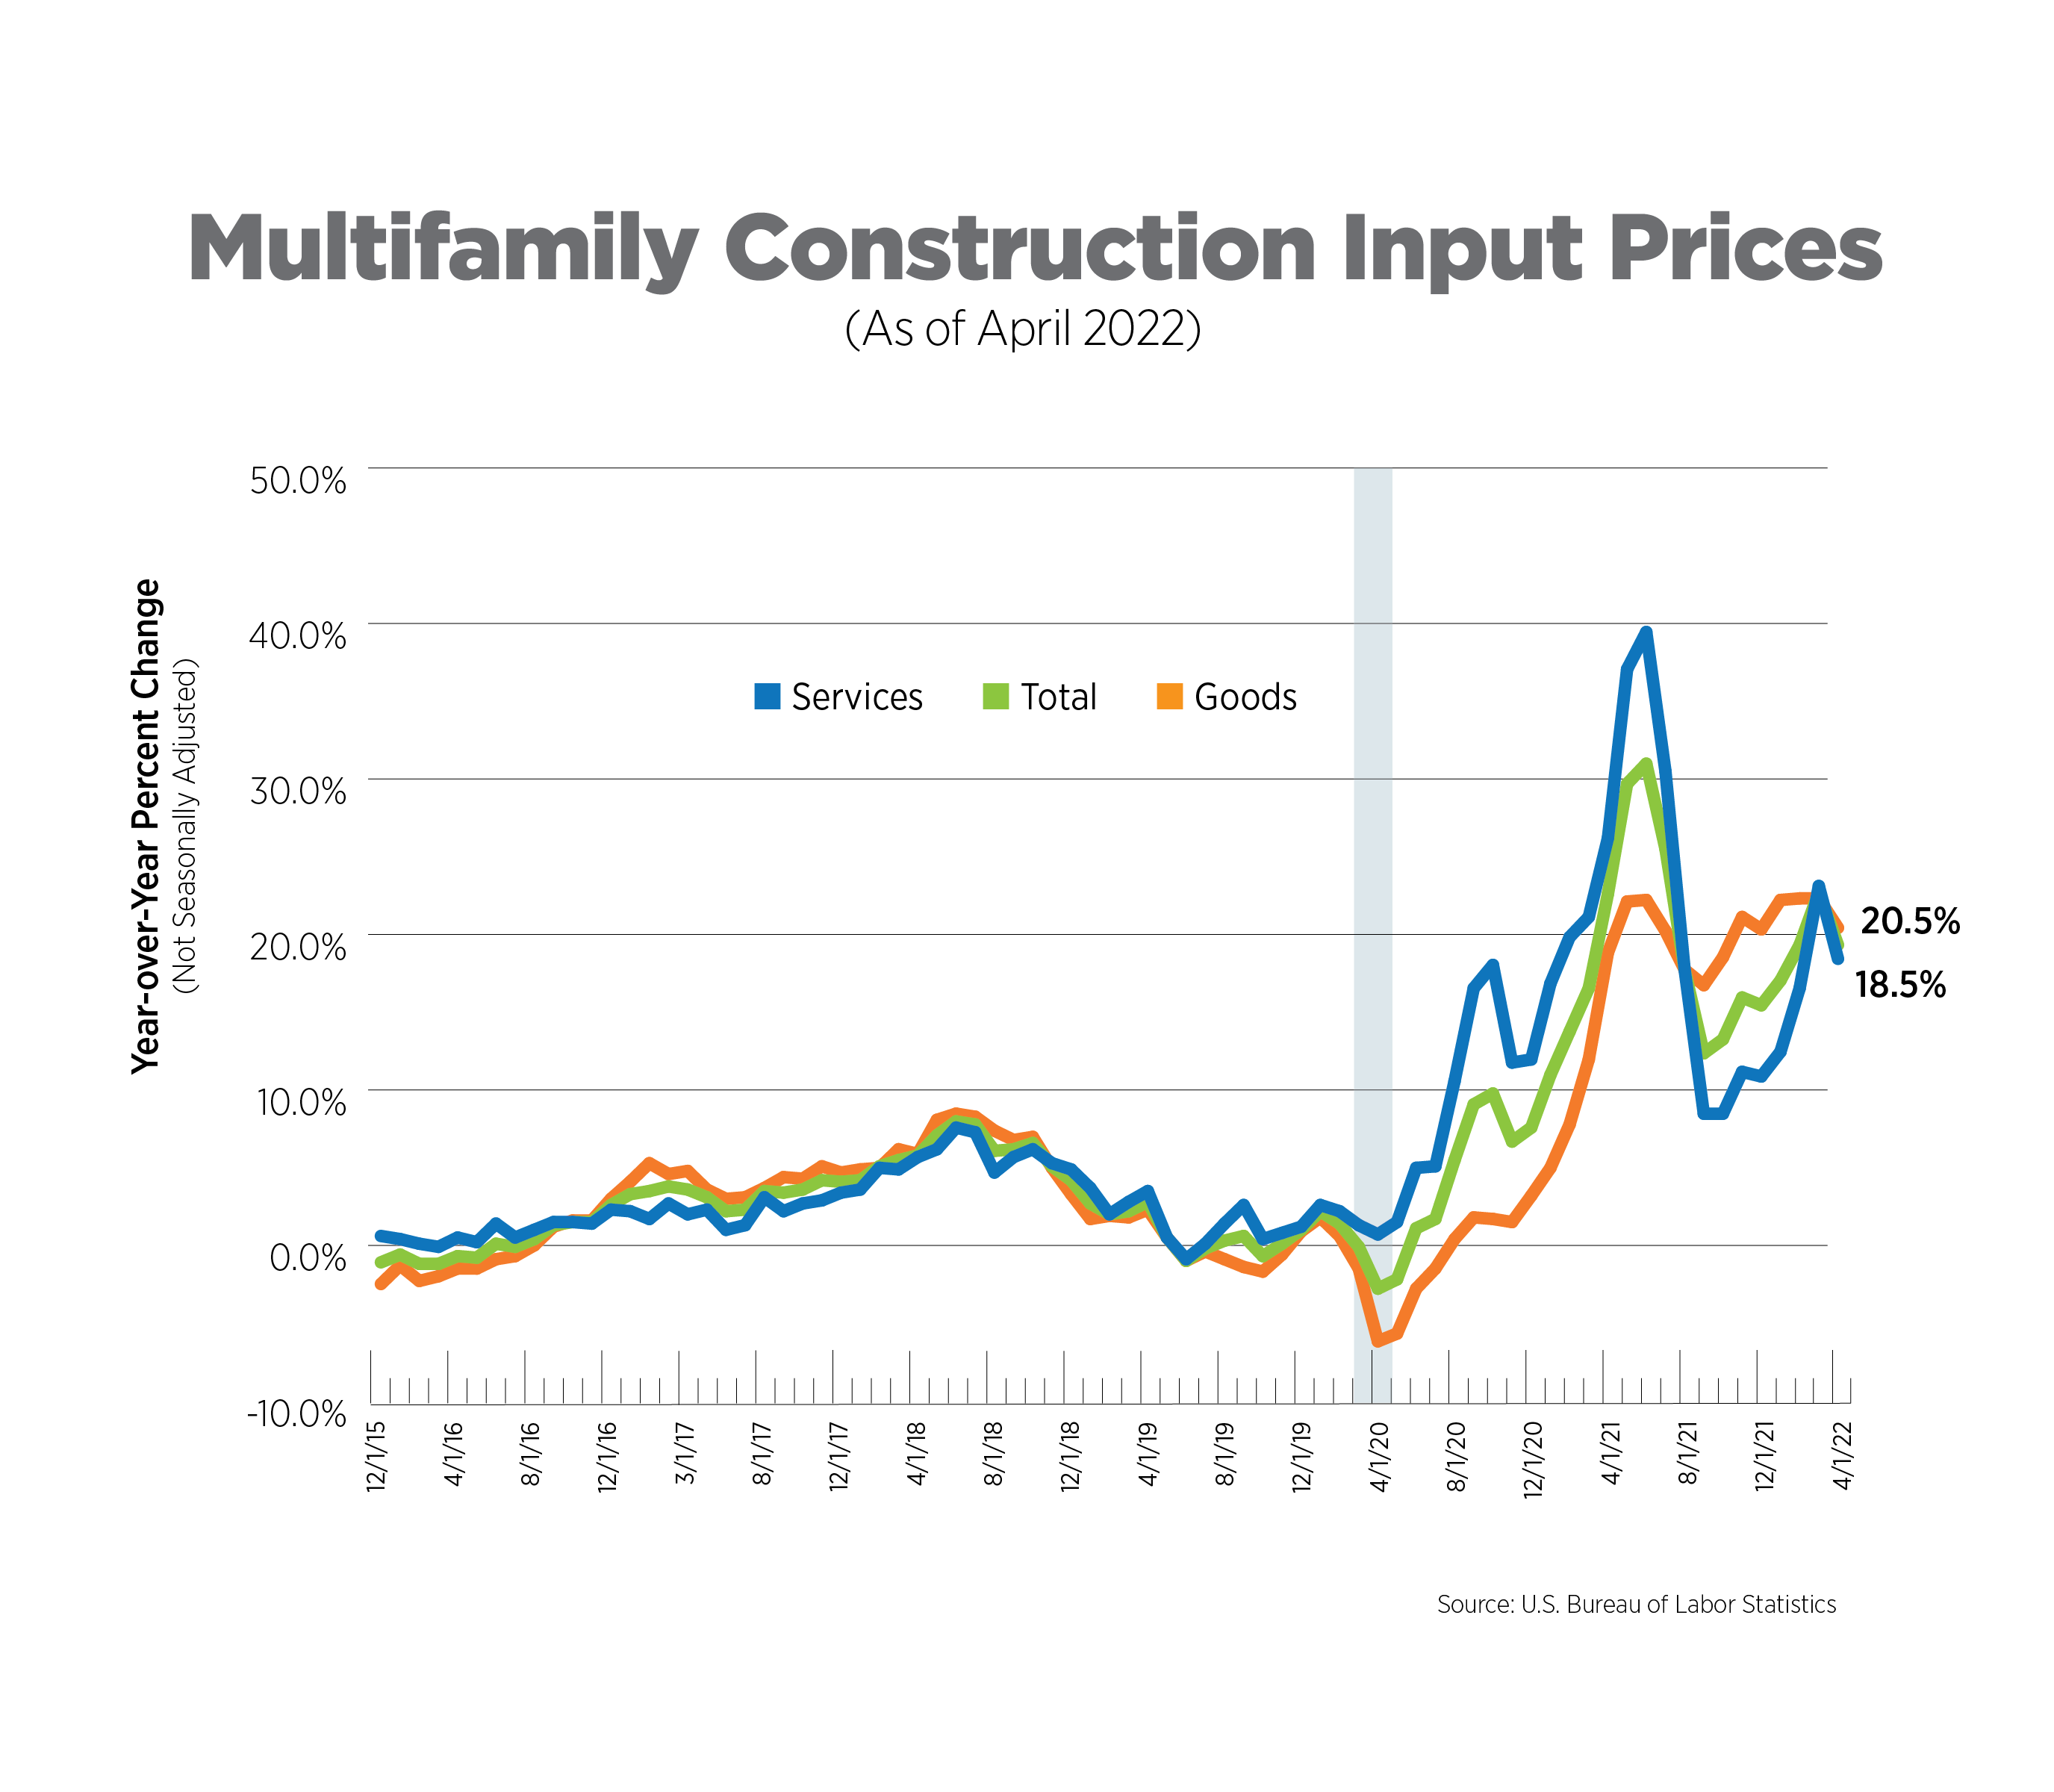
The Producer Price Index includes a compilation of prices which measures all inputs to multifamily construction, excluding capital investment, labor and imports. For goods, this means lumber, gypsum, steel and other building materials. For services, this includes financial, legal, engineering, architectural and transportation services, among others.
Costs for apartment construction increased 19.4% year-over-year in April. For the past four months, services costs have been outpacing goods cost. Costs for transportation and warehousing services experienced their highest level of increase, 27.4%, since the data series began in 2015. Fuel prices are projected to rise further, which will keep upward pressure on transportation services inputs.
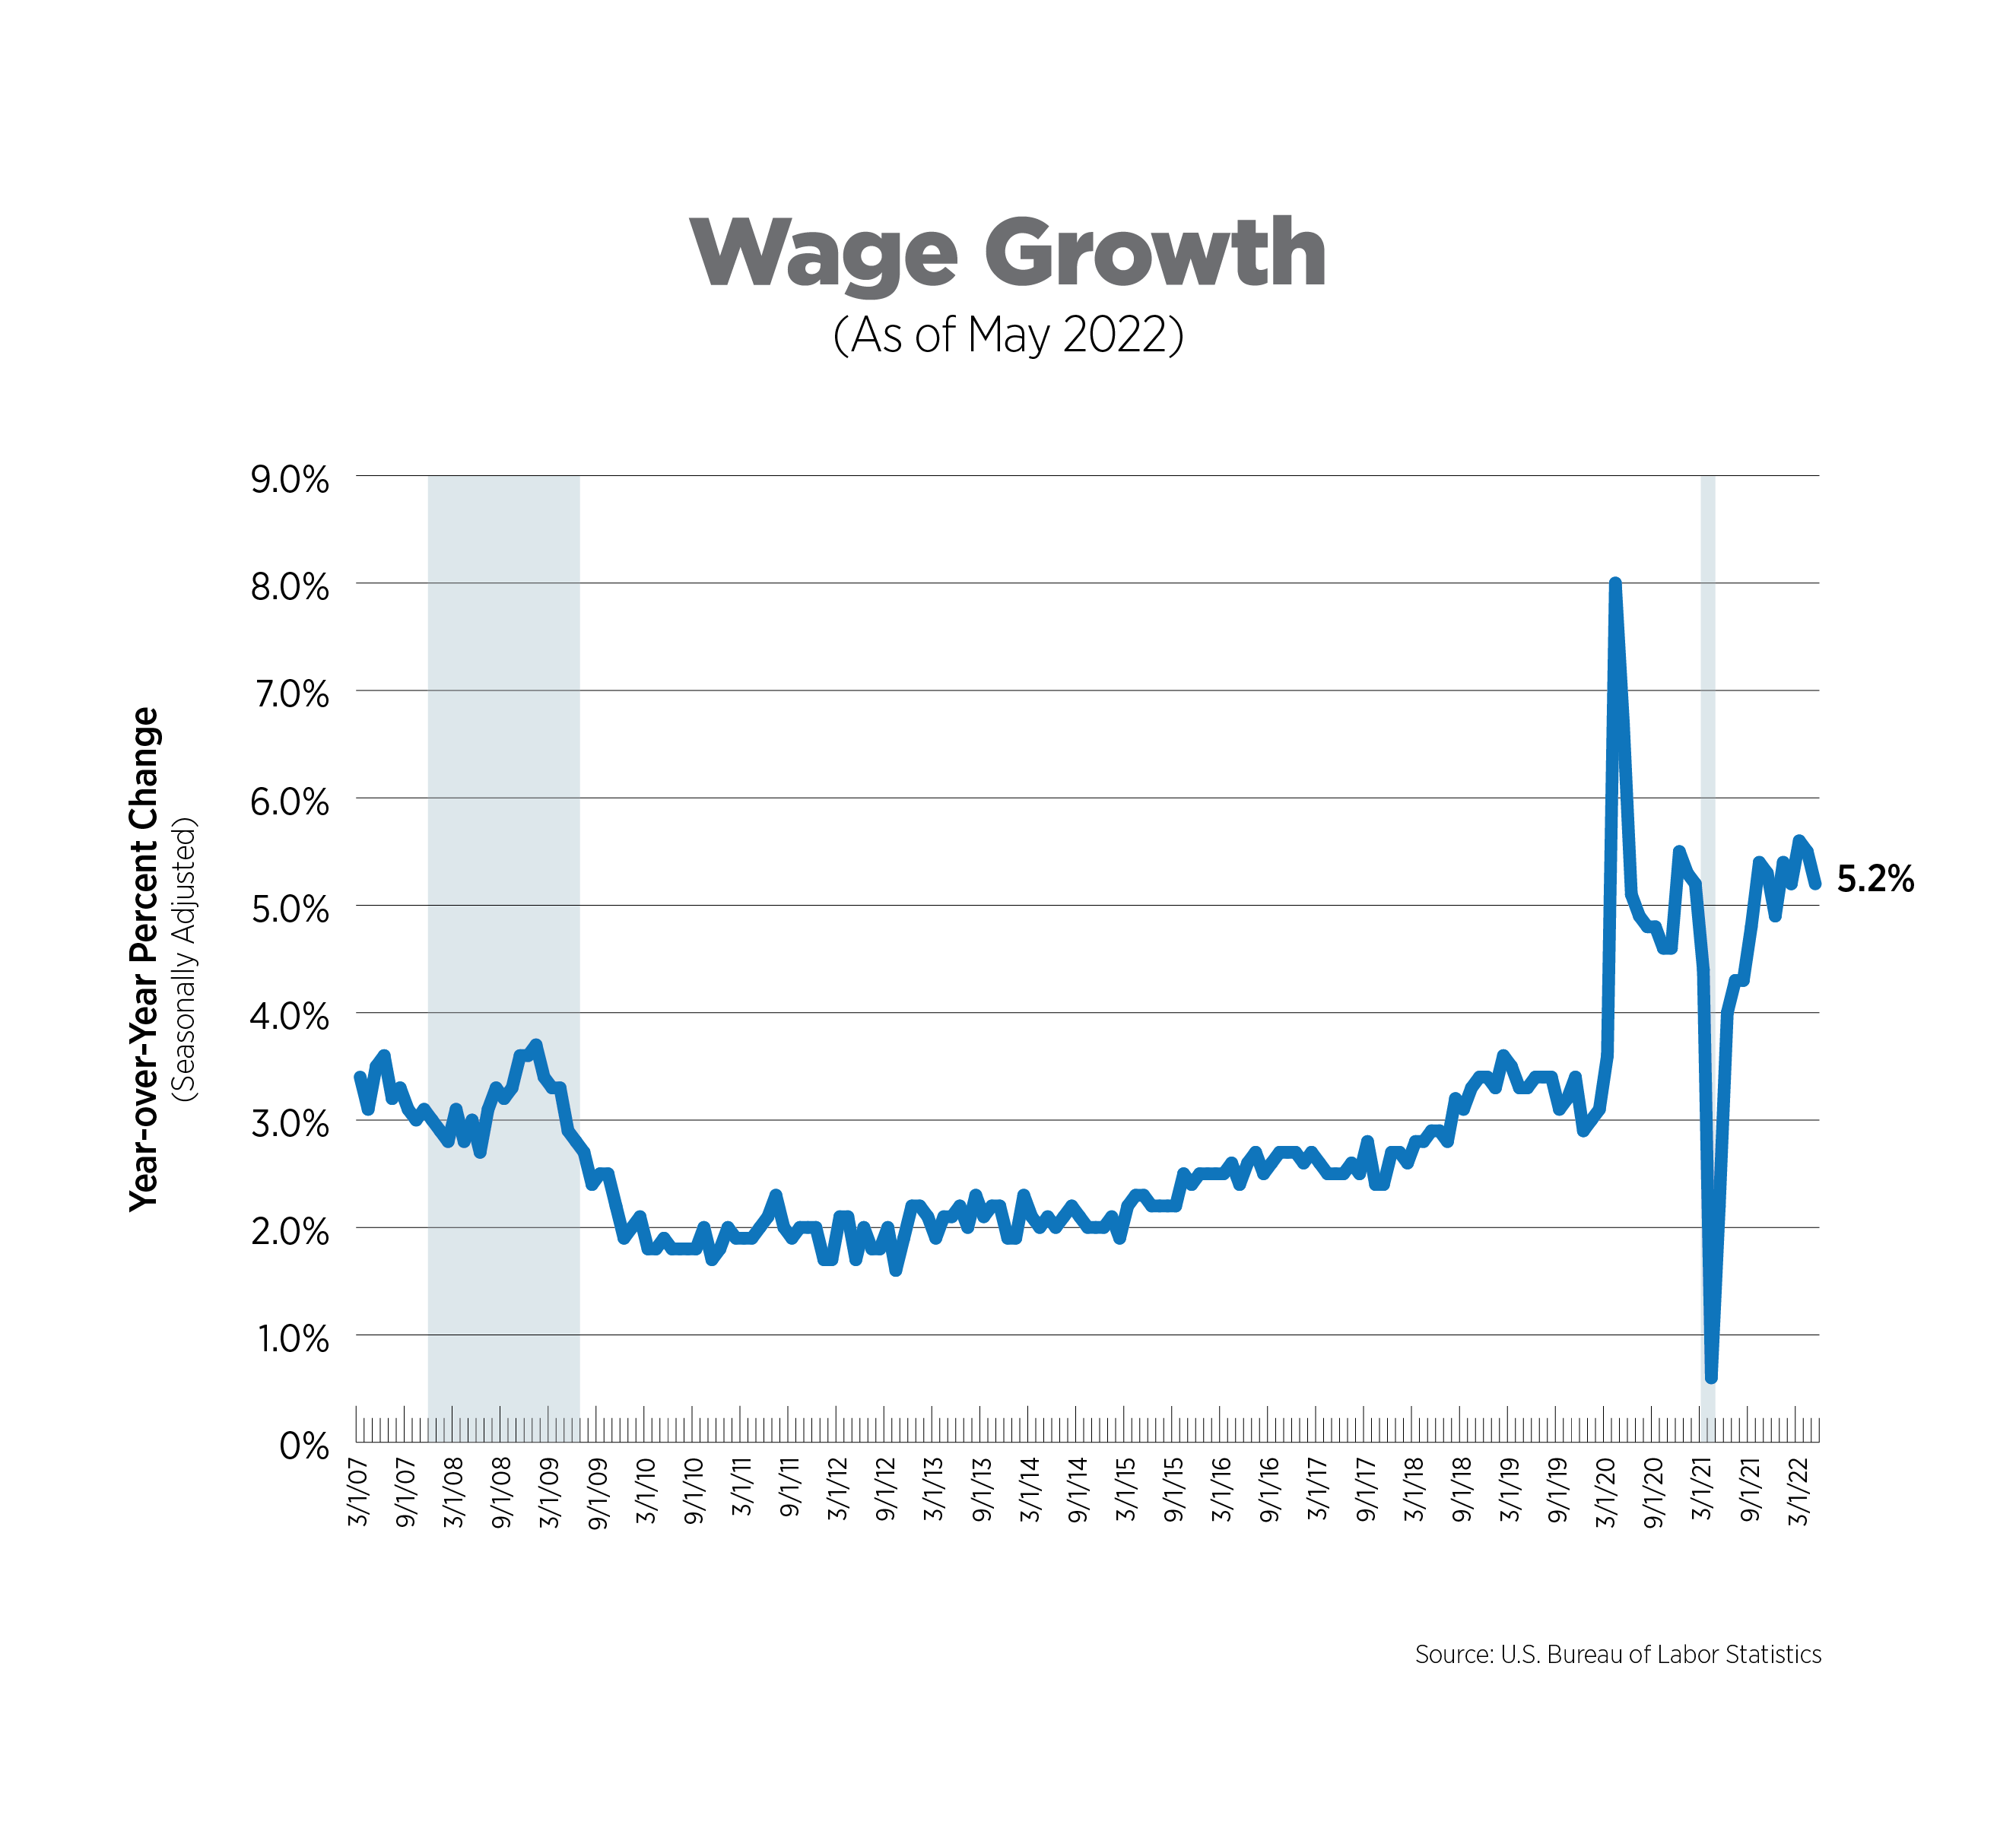
Wage Growth, May 2022
Wage growth, as measured by average hourly earnings, moderated somewhat to 5.2% year-over-year. Leisure/hospitality once again posted the largest gains (10.3%), followed by transportation/ warehousing (7.8%) and professional/business services (6.6%). Real disposable income, the amount consumers have left after taxes, adjusted for inflation, has declined for the past four months on a year-over-year basis. This is an important indicator of potential consumer spending, which is key to economic growth.
What to Watch in the Next Month
- Talks of recession have been rampant this week. The World Bank lowered its global growth forecast to 2.9% from 4.1% in January and stated that recessions will be “hard to avoid for many countries.” Additionally, the Atlanta Fed’s GDPNow tracker for Q2 2022 has slipped to 0.9% as of June 8. Should it slide into negative territory, it would infer a recession, based on the traditional definition of two consecutive quarters of negative growth.
- Several big data releases and events are scheduled for next week, which will provide further clues as to where the economy is heading:
- Federal Reserve Open Market Committee Meeting (June 14-15)
- The NFIB Small Business Optimism Survey (June 14)
- Retail Sales (June 15)
- The NAHB Housing Market Index (June 15)
- Census Survey of New Construction (June 16)
Next Tracker: July 13, 2022
